In 8th grade mathematics, students are placed in collaborative groups and work with one another to come to their own conceptual understanding of key mathematical concepts in an interactive, respectful, and challenging environment.
Volume and Surface Area
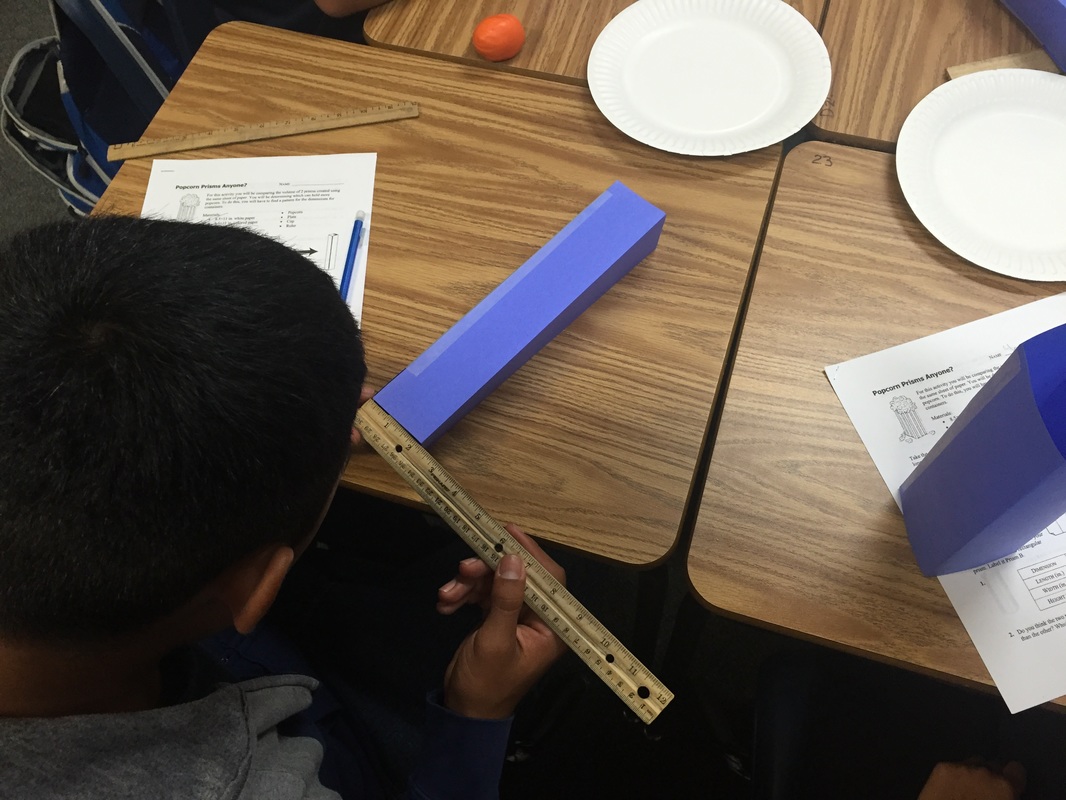
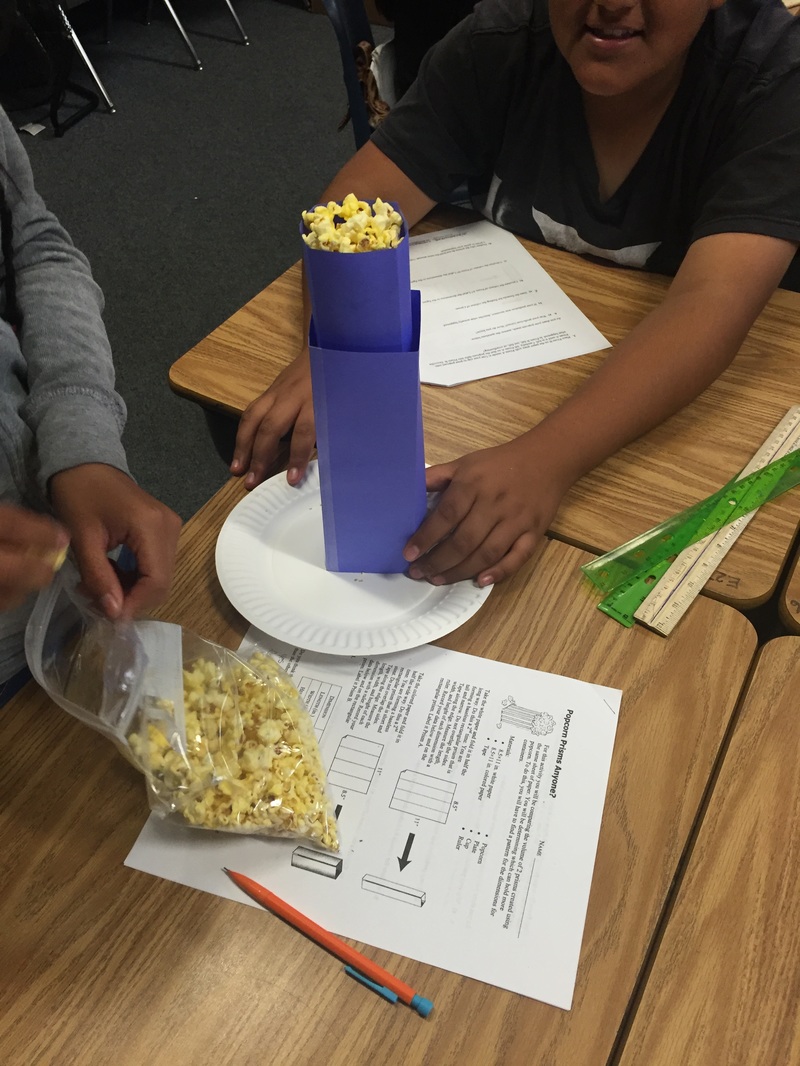
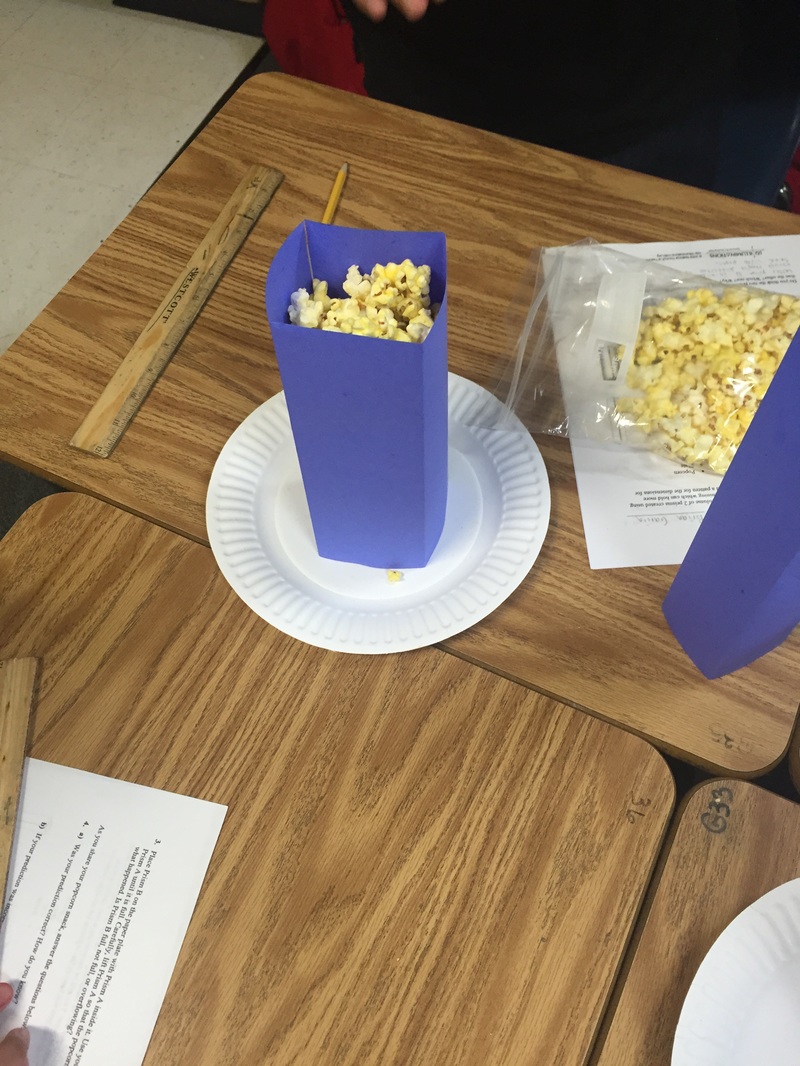
In this volume and surface area activity, students explored the essential question of how packaging designers used their understanding of volume to fit the most product into a package. Students constructed two rectangular prisms using the same surface area and then predicted whether or not the rectangular prisms would hold the same volume. They then put one rectangular prism inside the other, filled the innermost rectangular prism with popcorn (donated by the Santa Maria Edwards Movie Theater!), removed the innermost rectangular prism and found that the outer rectangular prism was not filled to the top with popcorn. Students then participated in a discussion about how this activity related to packaging design and how they could make better decisions about the packaging they choose the next time they go to the movie theaters and order popcorn!

|

|
More Surface Area!
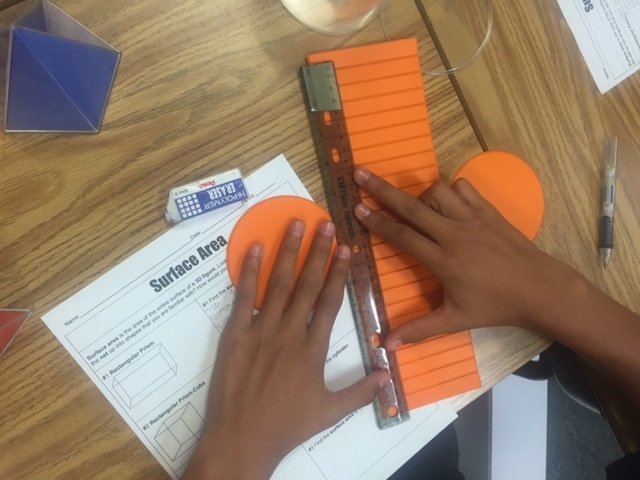
In this activity, students worked with 3-Dimensional shapes and their 2-Dimensional nets to find the surface area of each figure. The students loved getting the opportunity to collaborate in their groups and work with the hands on materials!

|

|
Transformations
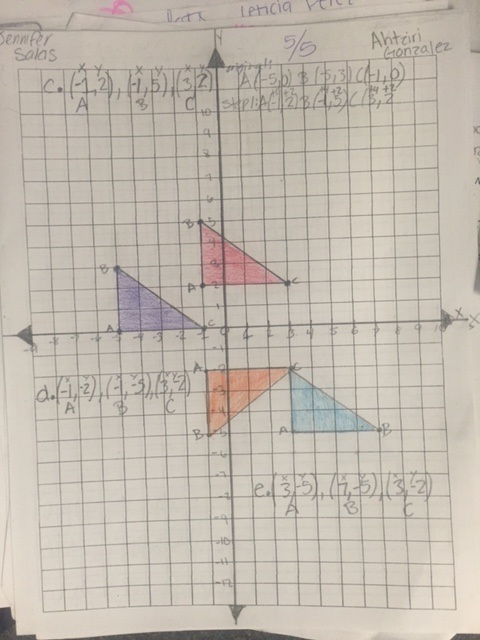
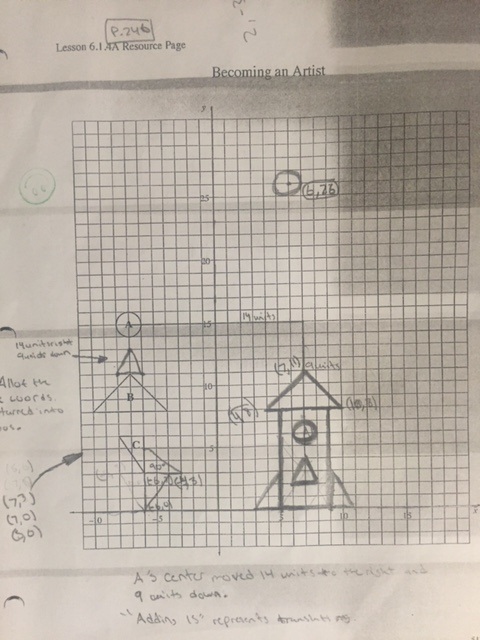
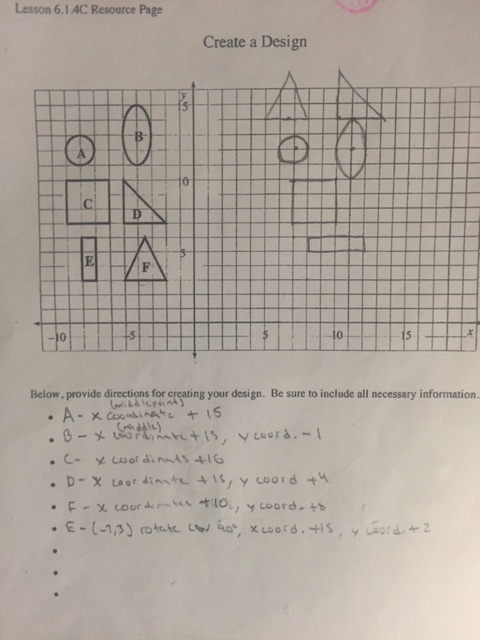
Students were introduced to transformations with the words "slide", "turn" and "flip" due to the fact that theses words were more familiar to them. They then participated in a CPM computer game that required them to move a key into a key hole by sliding, flipping or turning the key across a coordinate plane. At the end of the lesson, students were provided with the academic vocabulary to describe the movements they learned about throughout the lesson. Subsequent activities included graphing a triangle and transforming the coordinates of the triangle based on the provided directions. Students then analyzed the coordinates and discovered how each transformation affected them. Finally, students got the opportunity to create their own image by transforming different shapes and describing the different transformations.
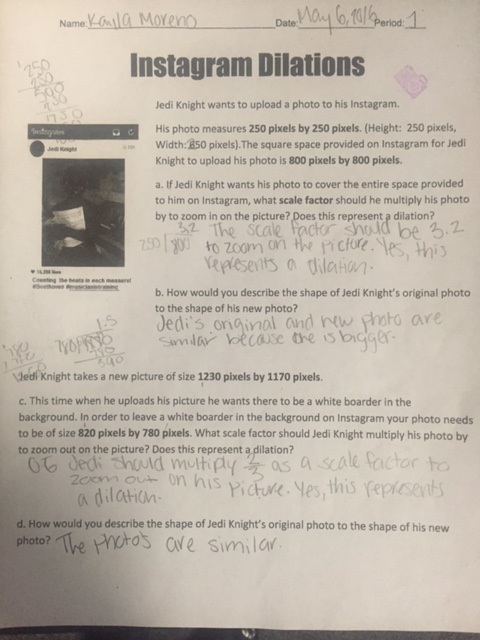
Dilations were introduced next, and students learned that dilations are often used to re-size a picture while keeping the resolution intact. Students then completed an activity that integrated the idea of Instagram and required students to re-size a photo using dilations so that it would fit in the space provided.
Dilations were introduced next, and students learned that dilations are often used to re-size a picture while keeping the resolution intact. Students then completed an activity that integrated the idea of Instagram and required students to re-size a photo using dilations so that it would fit in the space provided.
|
|
|
Scientific Notation
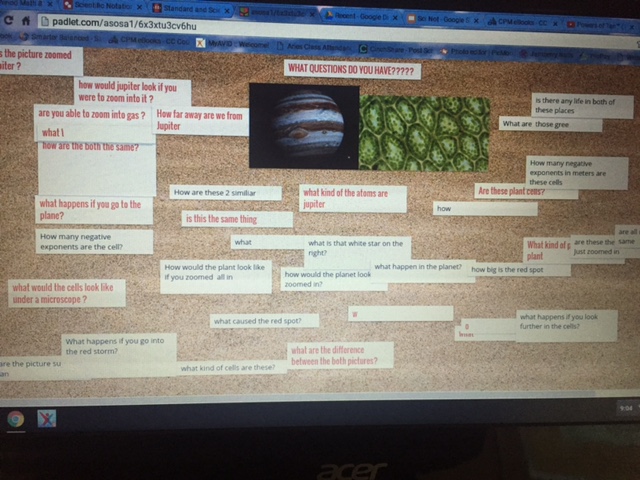
In this scientific notation lesson, students had the opportunity to use an application called Padlet which let them type in any questions they had about the provided images. Many of these questions focused on ideas about what these pictures were of and what size the objects in the pictures were. After some discussion of the different questions, students worked in groups and selected four planets that they would research in order to find the distance these planets were from the sun. Each group member also selected an item so small that it could not be measured with a ruler, and then researched the size of the item they selected. Once students found the information they needed, they were to then collaborate with their group and create a presentation in which the distance each planet was from the sun and the size of each selected item was written in standard and scientific notation. At the end of the lesson, the students returned to the questions on Padlet and came to the conclusion that scientists use scientific notation to aid them in succinctly writing the measurements of really large and really small objects.
|

|
Pythagorean Theorem
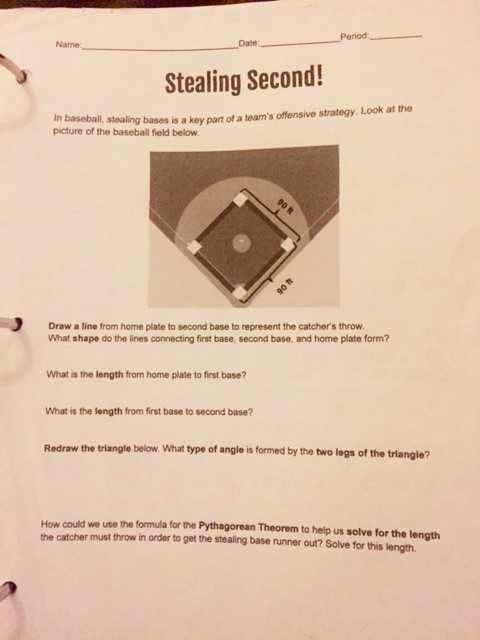
Students began this unit on the Pythagorean Theorem by cutting out the provided area squares and aligning the squares to see what kinds of triangles they formed. Using a graphic organizer, the students found that the sum of the area of a square constructed on the small side of a right triangle and the area of a square constructed on the medium side of a right triangle was equal to the area of a square constructed on the large side of a right triangle. Students later discovered this relationship as the Pythagorean Theorem, and when introduced to this academic vocabulary, the students were given the phonetic spelling and time was spent practicing the pronunciation of the term. students then applied their understanding of the Pythagorean Theorem to complete the "Stealing Second" worksheet which guided them through the process of finding the side length of a right triangle. Finally as a conclusion to the unit on the Pythagorean Theorem, students constructed Cornell Notes on the subject in their notebooks to solidify their understandings and to provide them with a place to reference the information in the future.

|

|
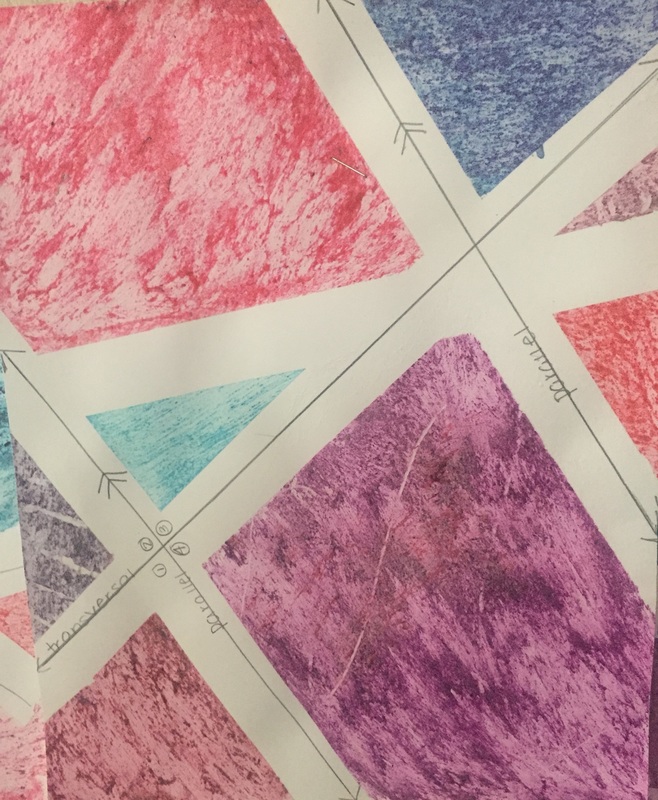
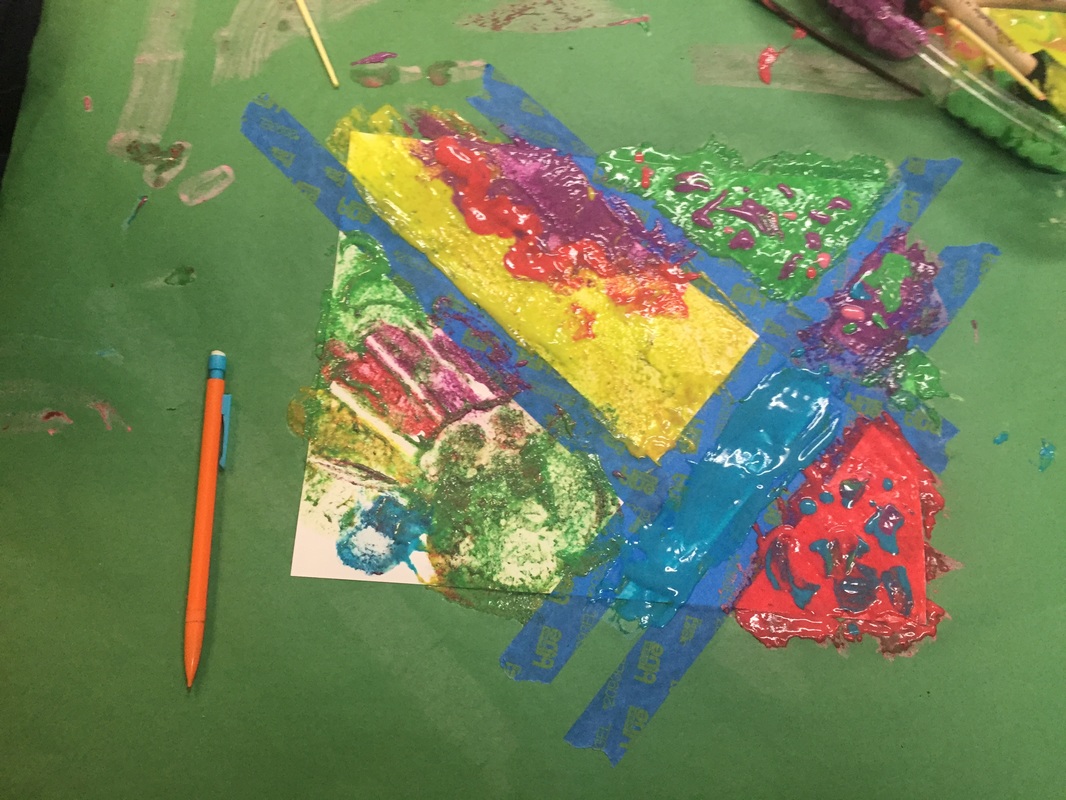
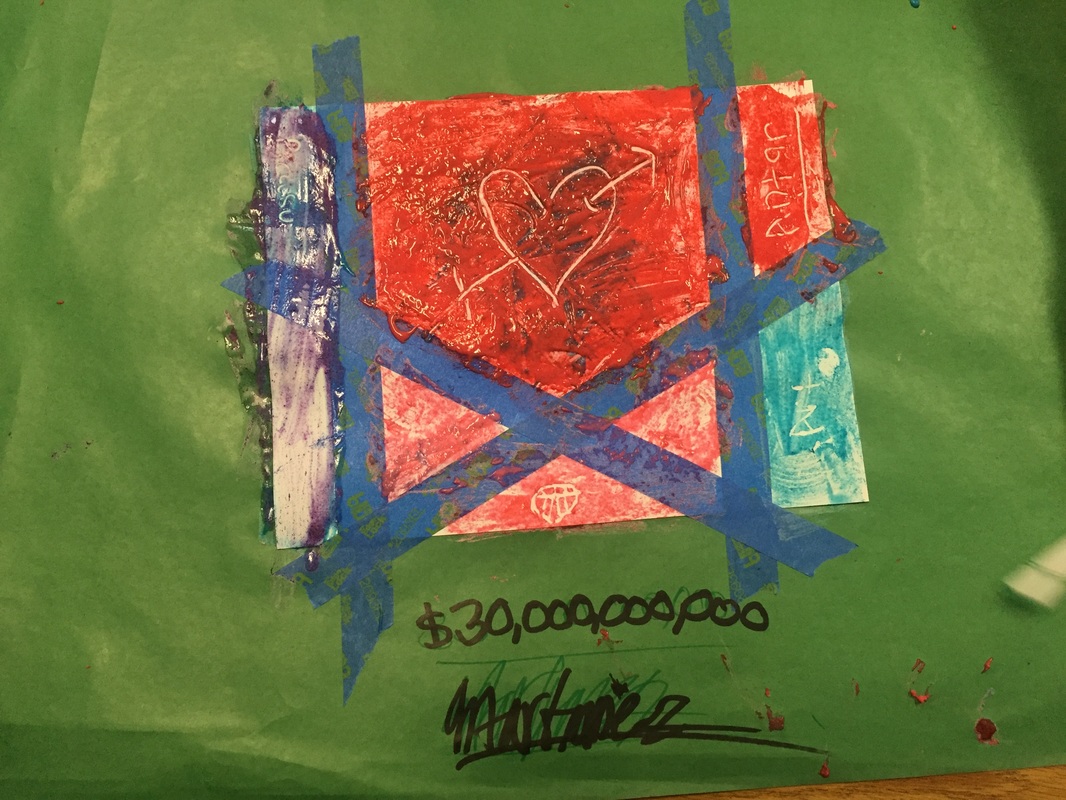
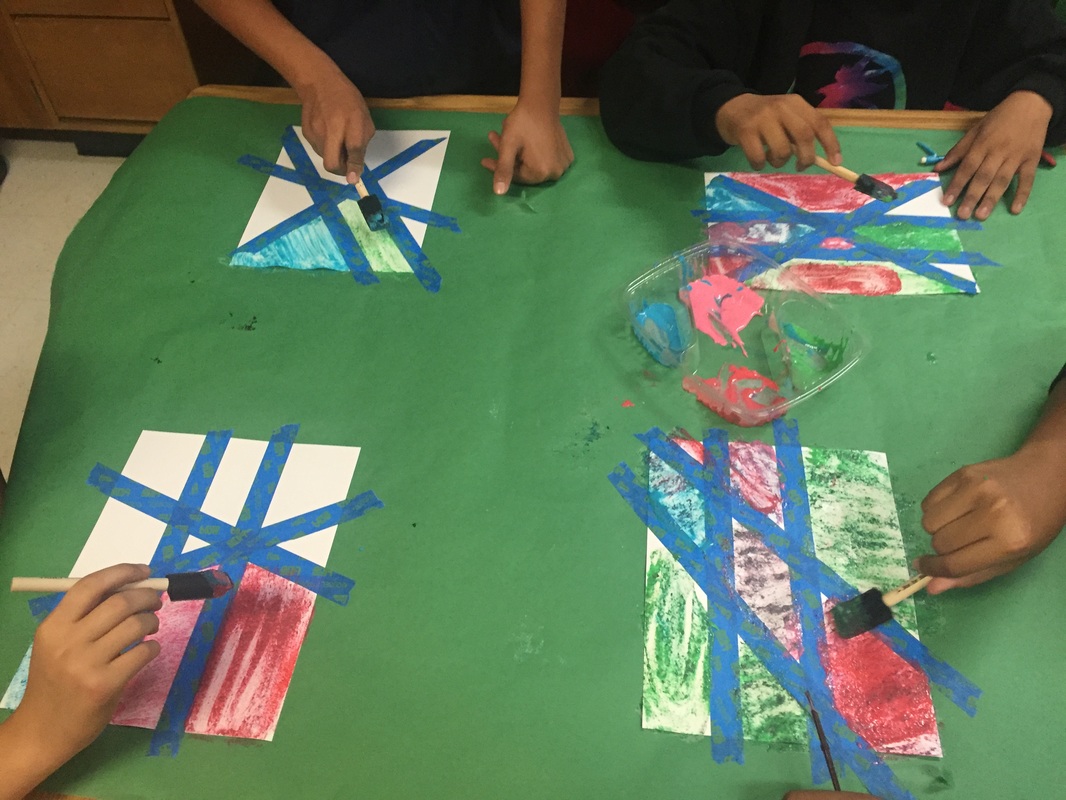
Angles
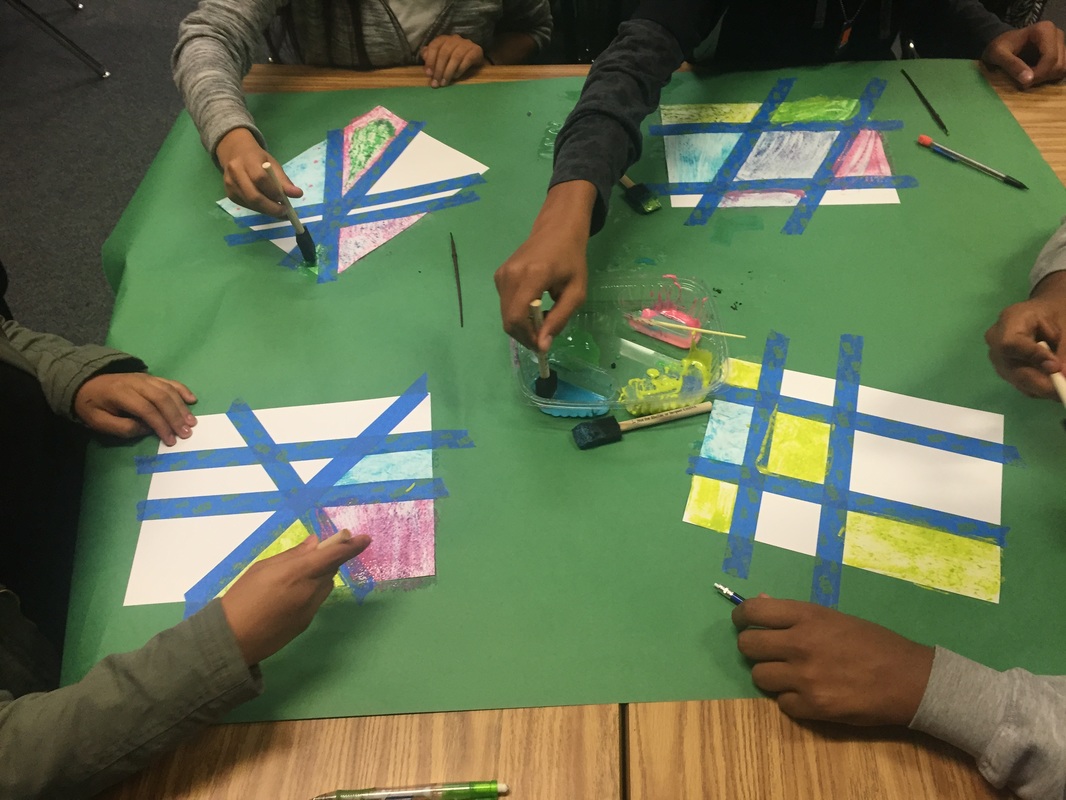
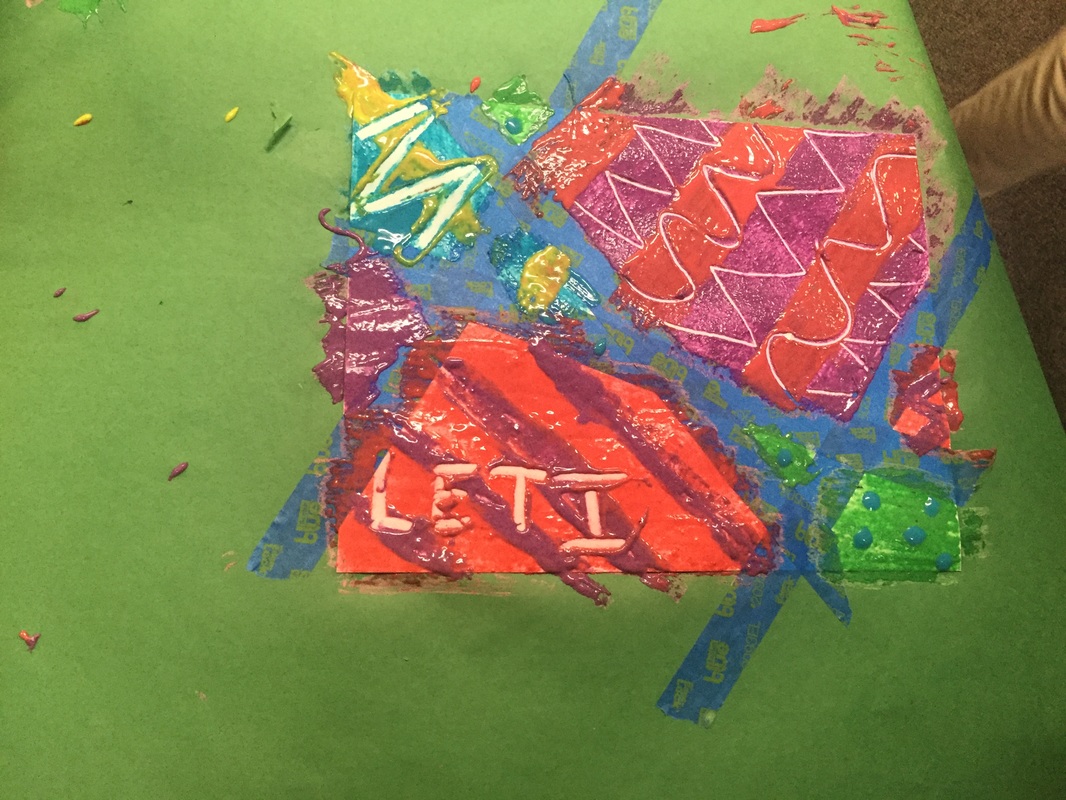
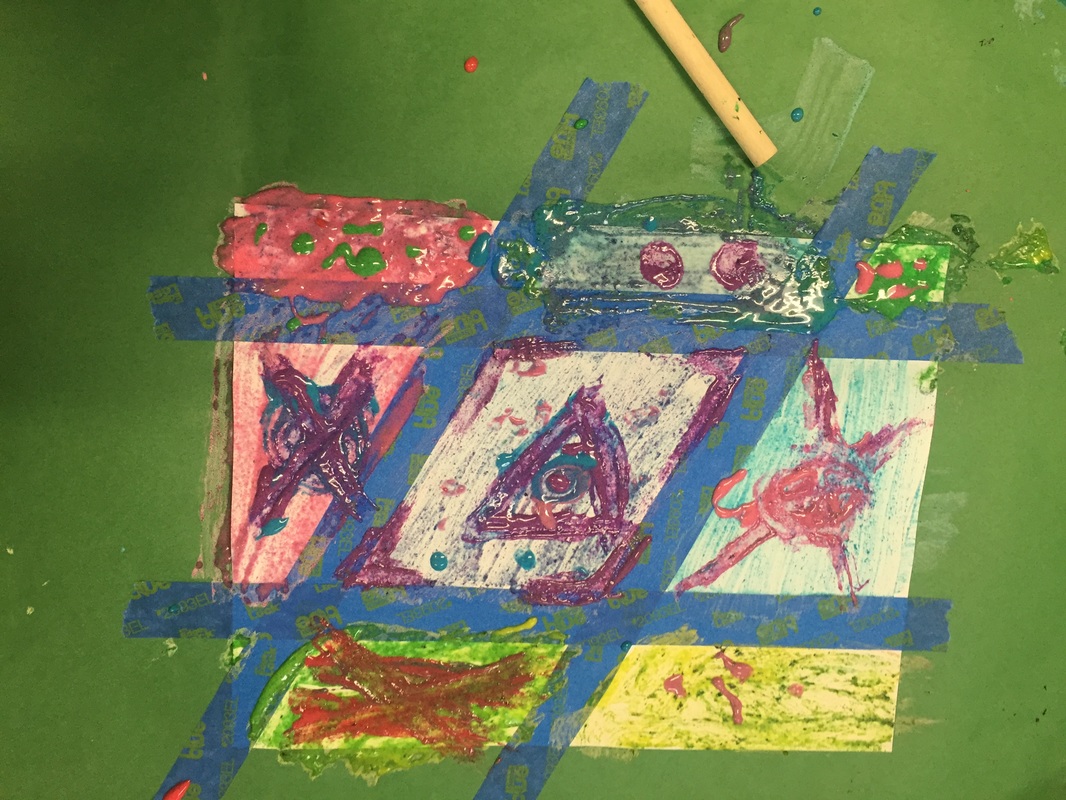
This arts integrated lesson on angles required students to use two pieces of tape to create a set of parallel lines across their canvas. Students then took a third piece of tape and put it on their paper so that it intersected both parallel lines. With the fourth piece of tape, students had free range to attach it wherever they liked. Students then painted over their lines of tape and set them to the side, peeling off the tape once the paint was dry. When the tape was removed, white lines were revealed. Students were then introduced to the term transversal line and had to identify on their painting where their transversal line was located. This process was similar for terms such as "alternate interior angles", "alternate exterior angles", "vertical angles", "adjacent angles", and "corresponding angles" . Students loved creating their own lines and their unique characteristics really came to life!
|

|

|
Triangle Angle Sum Theorem
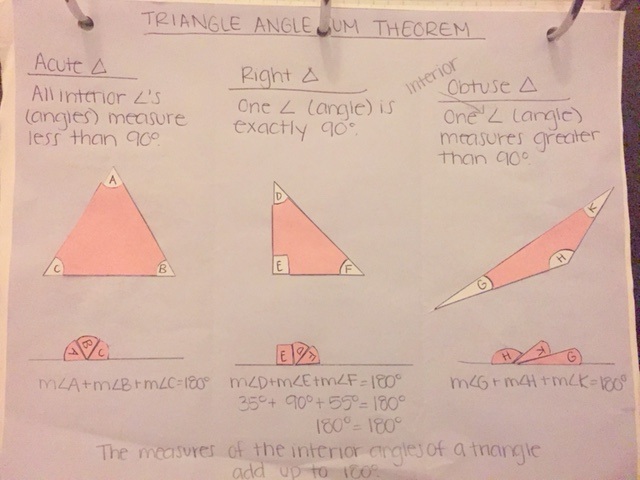
Students came to their own conceptual understanding of the Triangle Angle Sum Theorem by creating this fold-able in which they took the angles formed from each corner of a right, acute and obtuse triangle and discovered that when each triangle's angles were placed together they formed a straight line or 180 degrees. This fold-able was then stored in their notebooks so that they could recall their conclusions in the future.
Slope
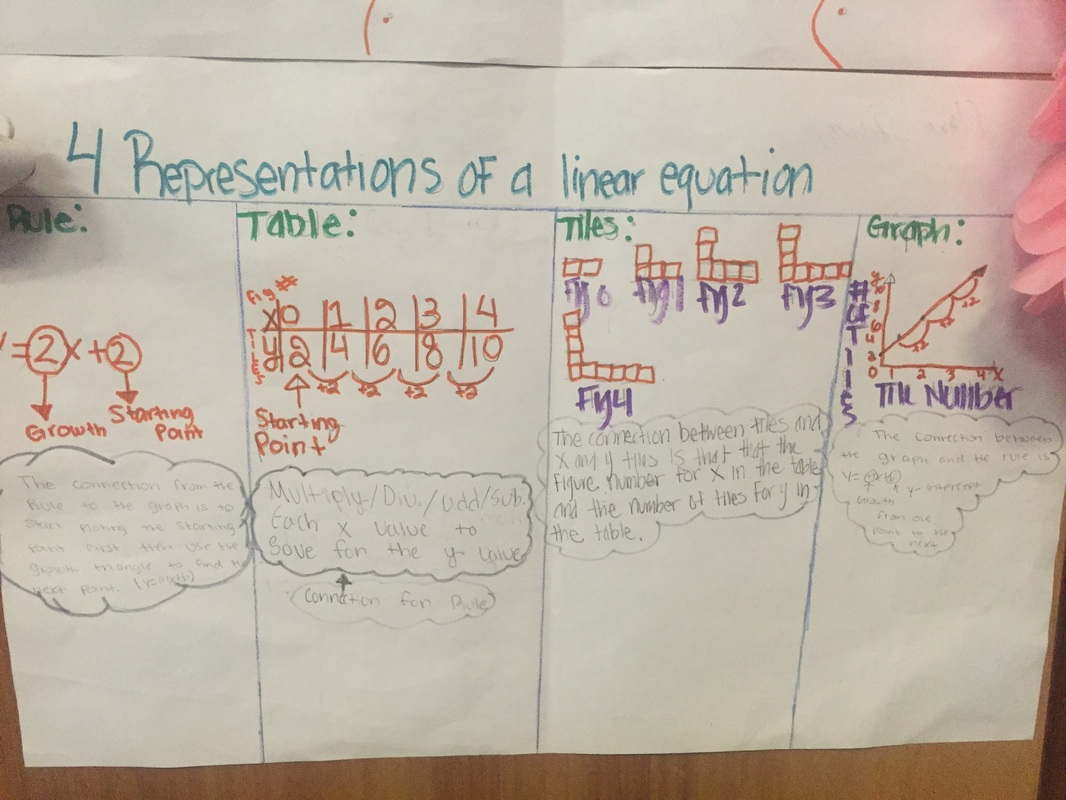
Students collaborated with their groups to create these connection posters that show the four ways to represent a line as well as how these four representations are connected to one another. Students began by representing a line with a tile pattern, this was how they initially were introduced to the concept of growth. They then created a table that represented the line and then described how the table was related to the tile pattern. Next, they came up with a rule, or liner equation, to represent the line and explained how they derived that equation using the table they had previously constructed. Finally, they used the linear equation they had discovered to graph the line and then explained how the graph related to the three previous representations. This assessed students' understanding of the four representations of a line as well as students' ability to make connections between them.

|

|
Line of Best Fit
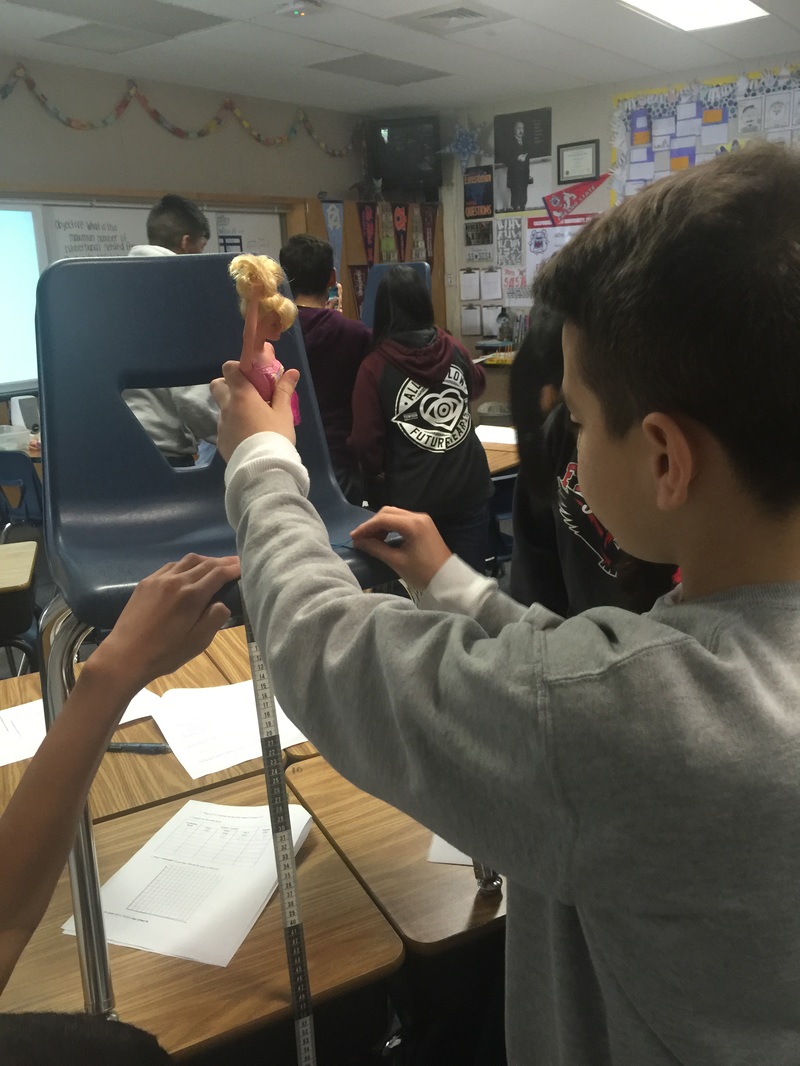
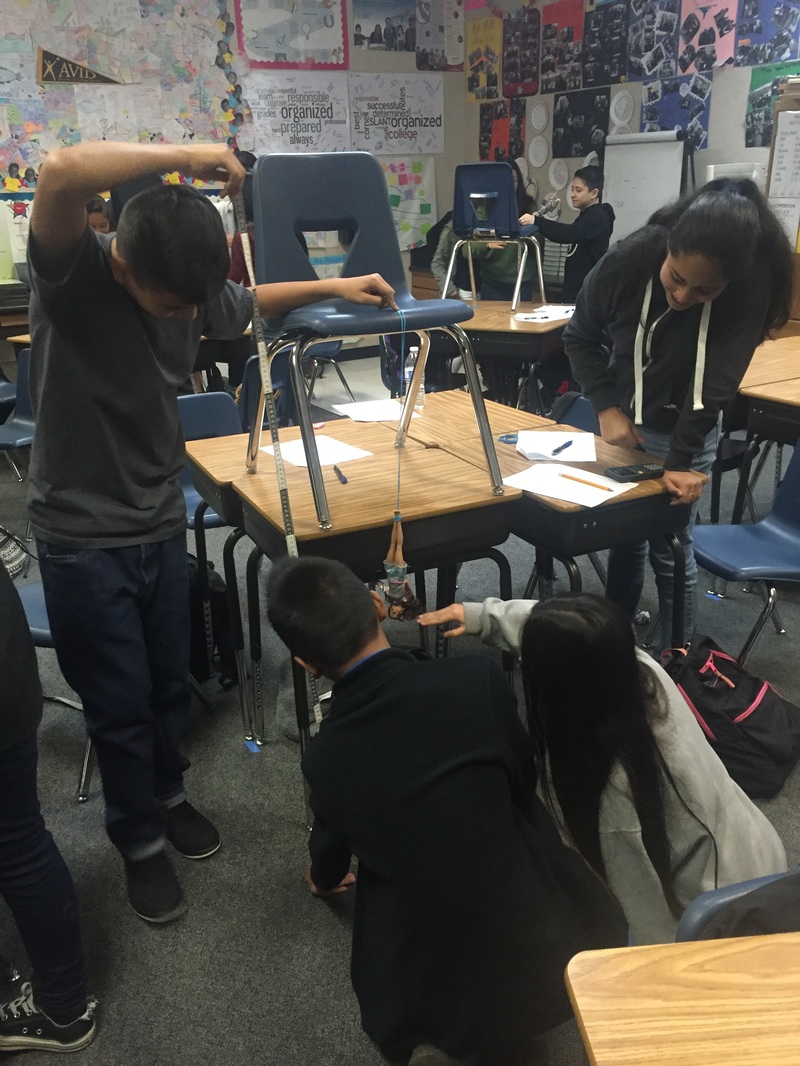
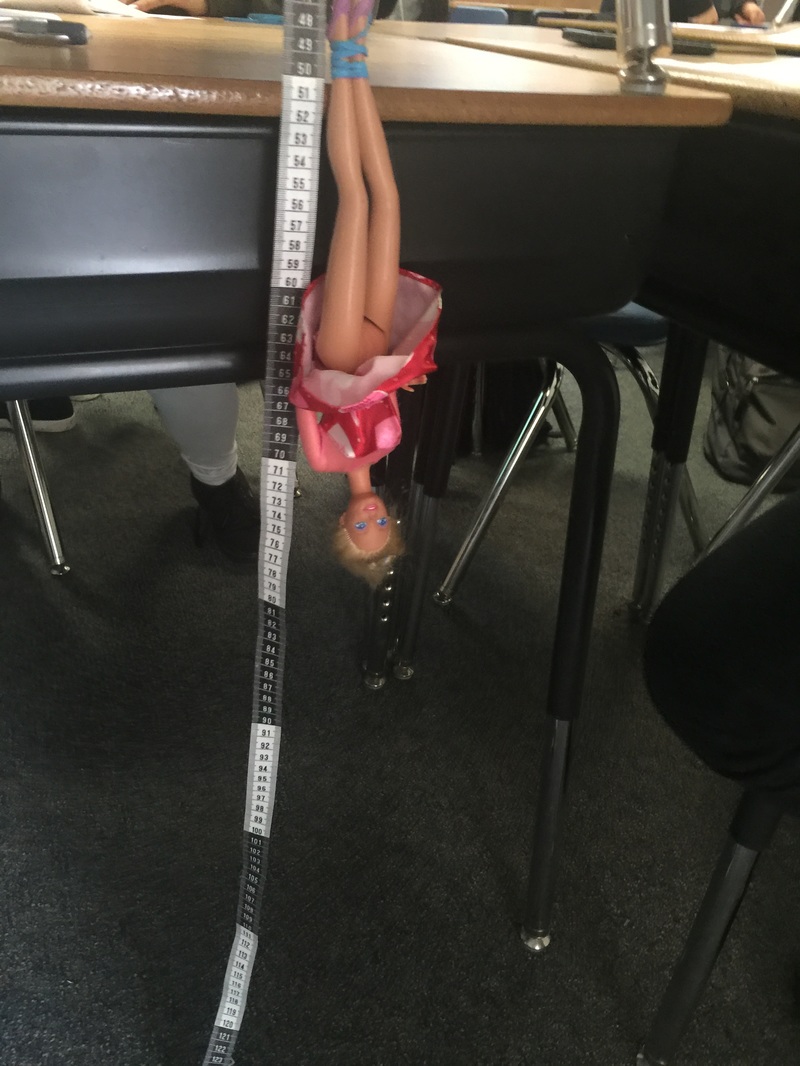
Barbie Bungee Jump
What's more fun than getting to launch a Barbie doll off a chair in math class? In this activity, students attached rubber bands to the legs of a toy Barbie and graphed the distance the Barbie fell each time a new rubber band was added. Each time the students added a new rubber band they completed three trials of launching the Barbie from the chair. They then graphed their data, creating a scatter plot, and estimated using a line of best fit the number of rubber bands needed to safely launch Barbie off the second floor of the E building. Once each group had completed their trials and made their prediction, the whole class went out to the E building and tested their predictions!
|
|
|

|

|
Graphing Shadows
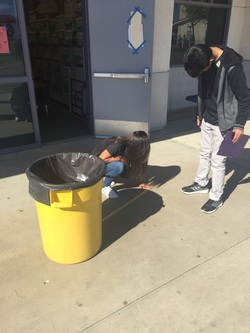
Integrating science with mathematics, this lesson required the students to measure the size of an object outside, and then record the height of the shadow of that object. After recording and graphing this information for several objects, the students analyzed their data and found a ratio or used a line of best fit to predict what the height of the shadow of a tree would be if the tree was 26 feet tall. Students also discussed the scientific aspect of why the other classes that met at a different time in the day may have different data.
|

|

|
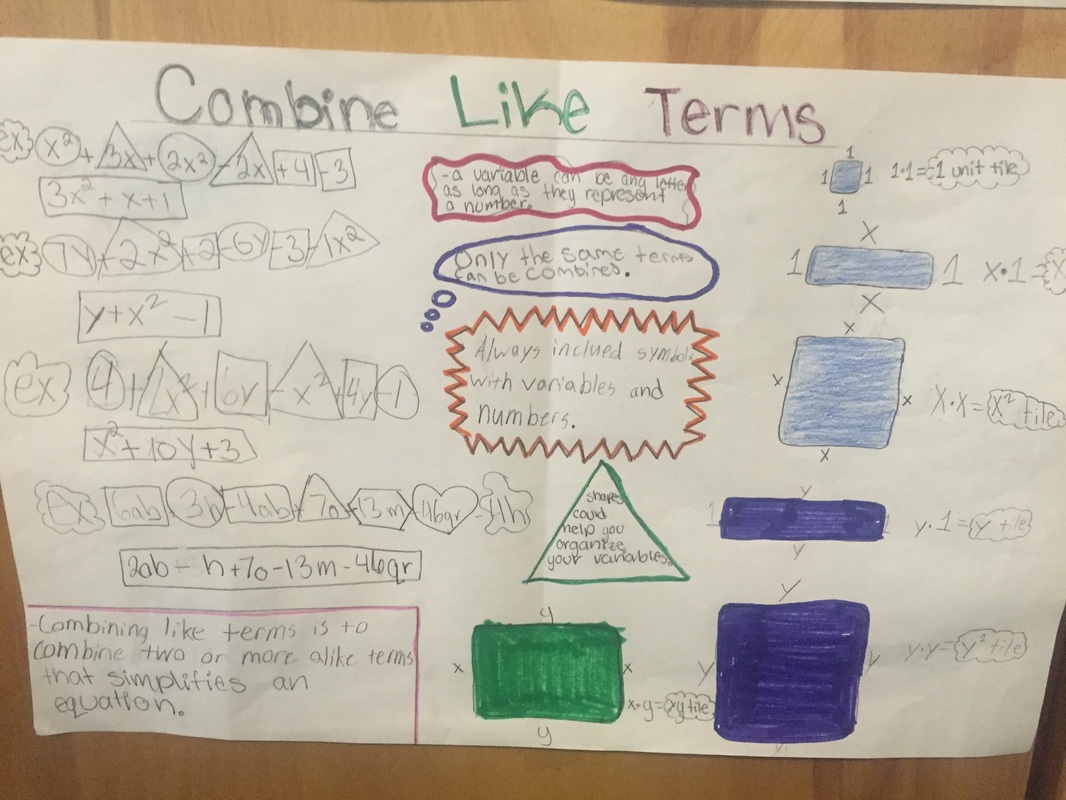
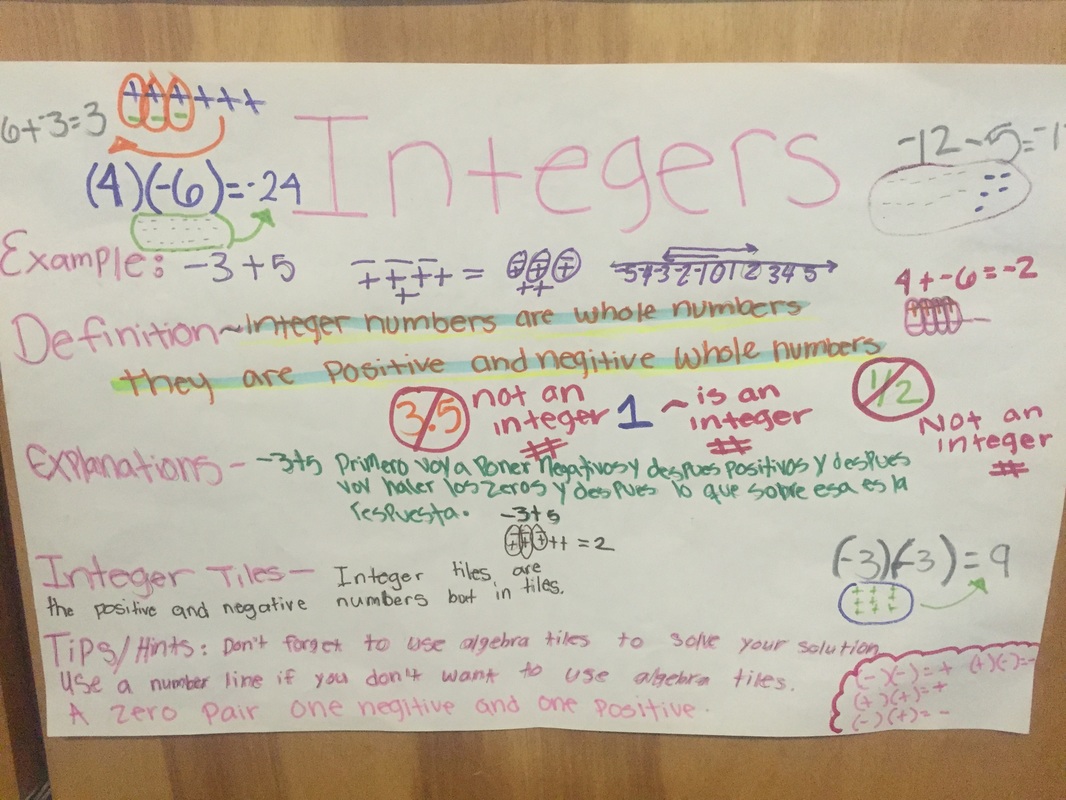
Winter Quarter Review!
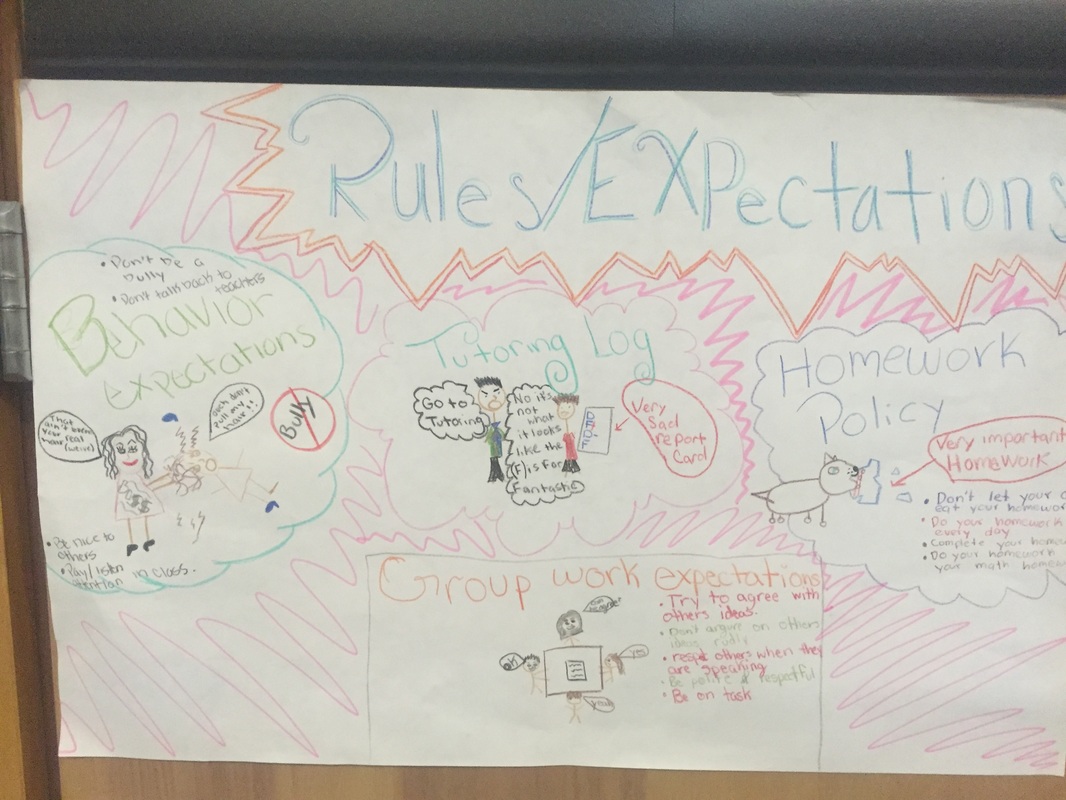
On the first day back from winter break, review was in order! Each group was assigned a topic and students worked in their groups to create posters highlighting the different concepts that they had learned in the previous quarter. Once students had completed their posters, each group presented to the class. After each presentation, students in the audience were able to ask the presenters questions to check for understanding. This served as a great review and laid a solid foundation for the continual development of students conceptual understanding.
|

|
|
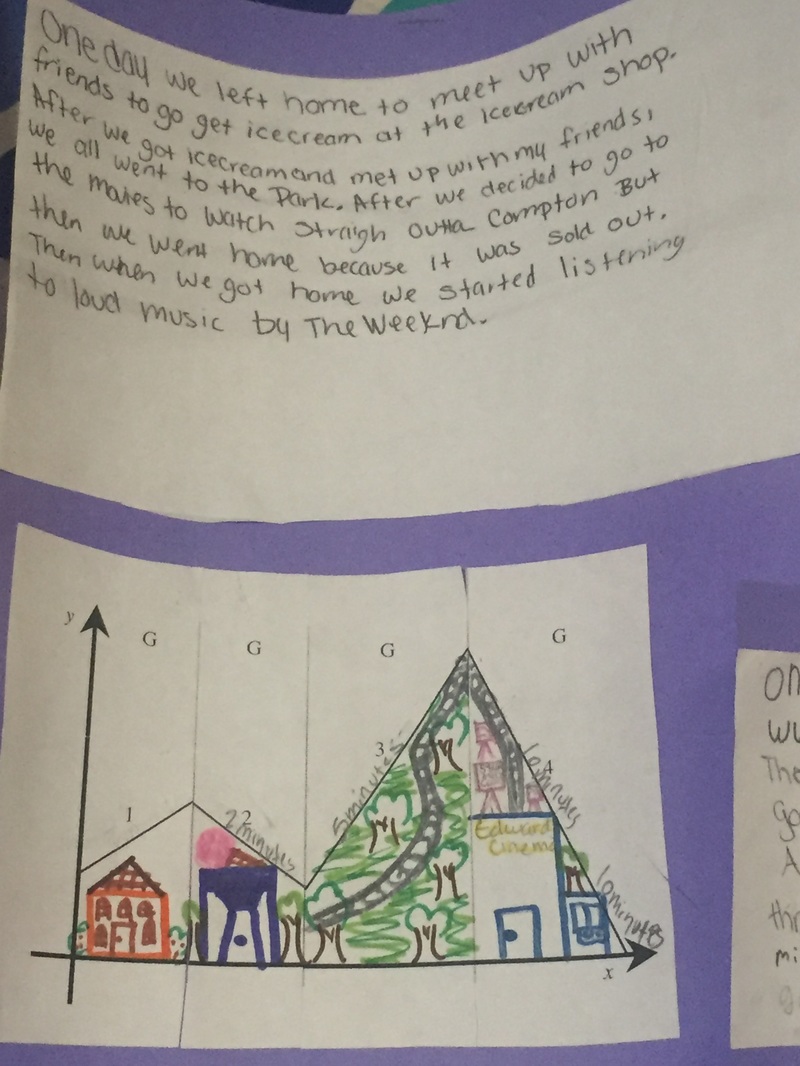
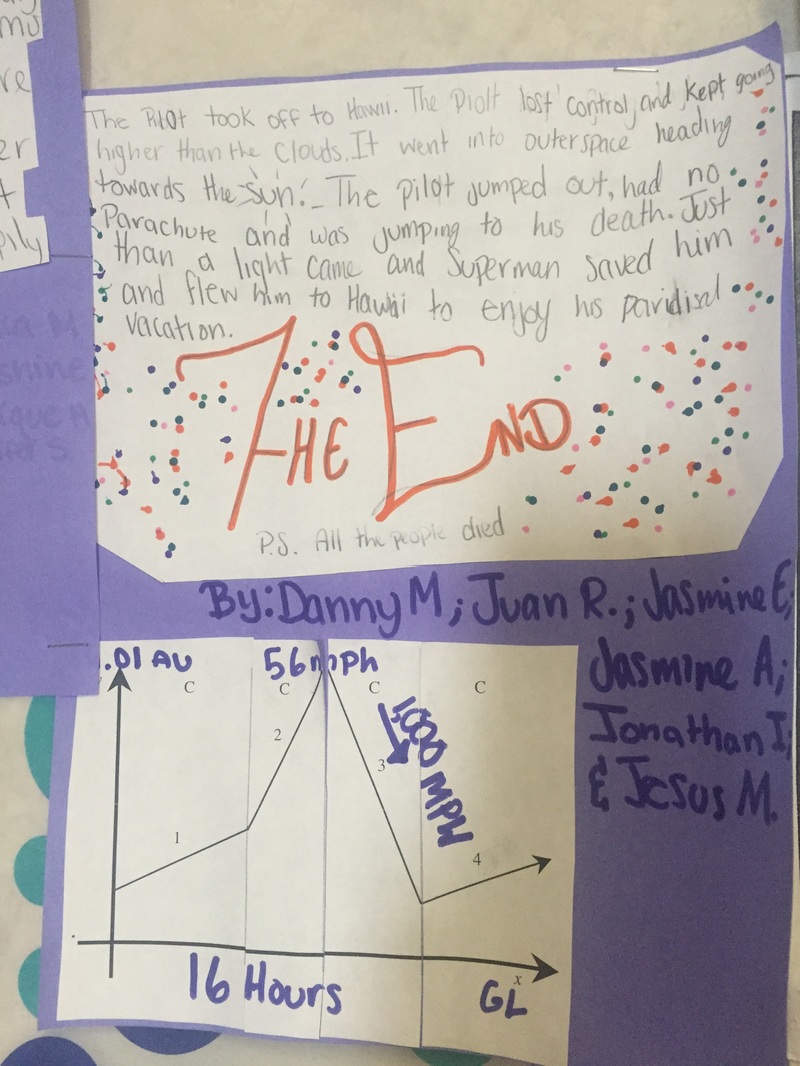
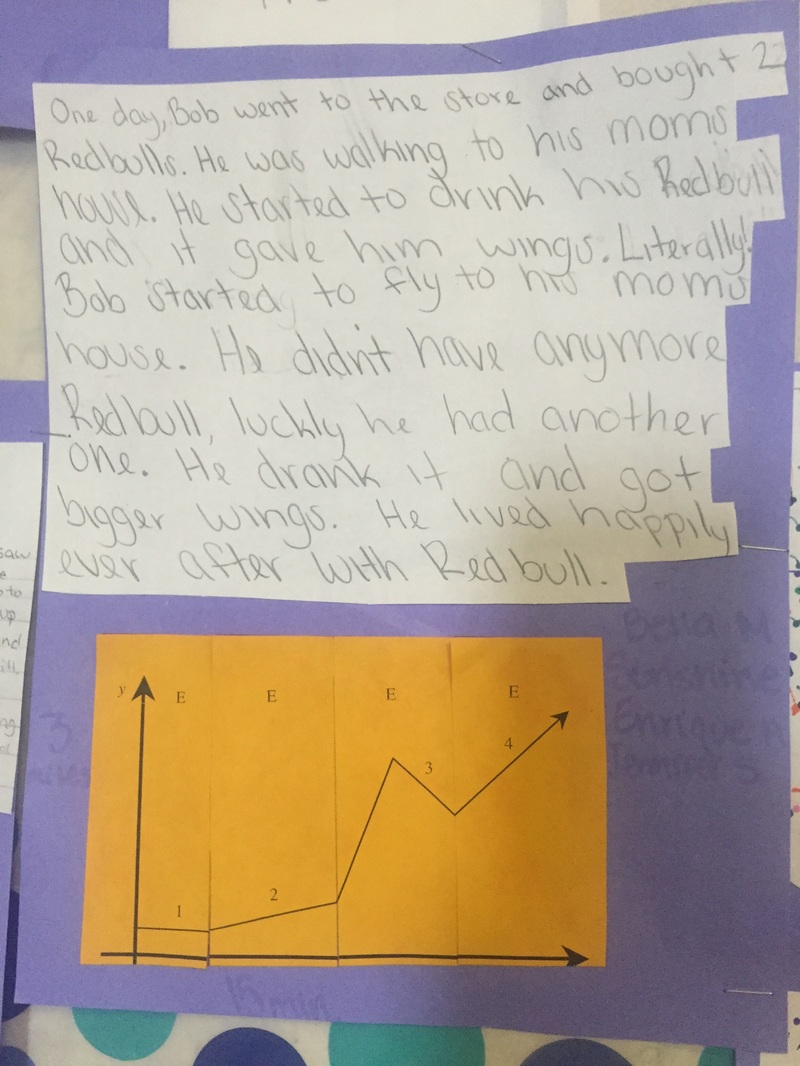
Interpreting Graphs
In their initial discovery of lines, students worked together to create a story that accurately represented their given line. Students had to think critically, and also creatively, to construct their story as well as had to collaborate with one another to come to a consensus about the story they would tell.
|
|
|
